(103-1) At GeoPark we understand and share the global concern about climate change and the importance of contributing to its mitigation. Our challenge is to maintain an efficient operation and commit ourselves to reducing greenhouse gas (GHG) emissions in our operations.
(103-2) We manage GHG emissions in GeoPark by measuring the organizational carbon footprint and identifying and implementing action plans to reduce our emissions, always focusing on opportunities to improve and control our processes.
Oil and gas companies that want to adapt to change and be competitive in the future by reducing their impact must develop GHG emissions management strategies.
With support from international consulting firm Kearney we therefore began to design a corporate strategy to guide us in our implementation of operational and environmental compensation initiatives to reduce the impact of GHG emissions from our activities.
Considering the subsequent recommendations, we decided to expand the scope of our GHG emissions inventory, helping us to update our corporate emissions baseline in 2020 for all operated assets in production. This process allows us to propose strategies that contribute to reducing emissions in the medium and long term.
In 2020 we continued with important projects and promoted new ones to:
In 2021 we will have the chance to share the impact of these activities on reducing GHG emissions.
(103-3) GeoPark has measured, reported and verified GHG emissions and carbon intensity with Scope 1, 2 and 3 since 2017. The GHG emissions inventory covered only the operations of the Llanos 34 block, which represents about 83% of the Company’s total production, while Scope 3 included only transportation aspects of the production and the disposal of regular and hazardous waste.
In 2020 we estimated corporate GHG emissions, considering six steps to define the scope of the inventory:
Through this exercise we estimated the 2020 emissions intensity baseline for all our corporate production assets (Colombia, Argentina and Chile) with Scope 1 and 2, using an operational approach. In addition, we estimated our Scope 3 CO2e emissions, including emissions associated with the end use of products, transport activities contracted with third parties and final waste disposal.
(305-1) (305-2) SASB: EM-EP-110a.2. IPIECA: CCE-4 Direct and indirect GHG emissions (Scope 1 and 2) (tCO2e) per asset
(305-3) Direct and indirect GHG emissions (Scope 3) (tCO2e) per asset
At GeoPark we use the GHG Protocol as the standard for calculating the GHG emissions inventory.
See historical GHG emissions information in the Environment Appendix.
Corporate Scope 1 and 2 GHG emissions in 2020 were 388,738 tons of CO2eq, of which the Llanos 34 block represented 77.4%. Power generation from natural gas accounts for most emissions on this asset.
Although GeoPark has earlier emissions information than 2020, the change in scope through including other assets in measurements means that that year cannot be compared to previous periods. In future reports, the base year and the methodology will therefore be those applied in 2020.
In 2020, our intensity index was 15.2 kg CO2e/boe. This was 28.3% below the 21.2 kg CO2e/boe industry average calculated in a benchmarking activity by Kearney based on information from annual and sustainability reports from companies analyzed.
The GHG emissions intensity indicator for Platanillo was 29.9 kg CO2e/boe, in this asset more than half of power is generated from fuel oil, and crude oil production corresponds to only 3.8% of the company’s total.
The emissions intensity of El Porvenir in Argentina’s Neuquen province was 50 kg CO2e/boe. In this asset 98% of power is obtained from gas, and the production of crude oil is only 0.7% of the company’s total.
In these cases the indicator was high due to the low production levels of the blocks.
(305-4) Emissions intensity
Emissions intensity GeoPark – Scope 1 and 2 (kg CO2e/boe)
Different emissions sources were considered in the exercise to define the 2020 baseline, including those associated with gas flaring, controlled emissions, and fugitive emissions.
Total emissions by source (t/CO2e)
Blocks | Generators | Boilers | Motors | Flaring | Controlled emissions | Fugitive emissions | Contracted energy | Total by block |
Llanos 34 | 184,562.3 | 38,919.0 | - | 4,066.3 | - | 73,469.1 | - | 301,016.5 |
Platanillo | 23,886.9 | - | - | 1,920.9 | - | 3,123.1 | - | 28,930.9 |
Fell | 5,639.5 | 5,432.9 | 4,803.5 | 3,032.5 | 8,816.7 | 3,166.6 | - | 30,891.3 |
Aguada Baguales | 12,545.0 | 780.2 | - | - | - | 1,461.5 | 302.4 | 15,089.1 |
El Porvenir | 7,599.8 | - | - | - | - | 493.8 | 246.9 | 8,340.5 |
Puesto Touquet | 0.4 | - | 3,728.3 | - | - | 548.3 | - | 4,277.0 |
Administrative | 79.7 | 112.8 | 192.5 | |||||
Total | 234,313.6 | 45,131.6 | 8,531.8 | 9,019.6 | 8,816.9 | 82,262.3 | 662.1 | 388,737.8 |
% emissions by source | 60.28% | 11.61% | 2.19% | 2.32% | 2.27% | 21.16% | 0.17% | 100% |
Participation of GHG emissions source by block
Block | Generators | Boilers | Motors | Flaring | Controlled emissions | Fugitive emissions | Contracted energy | Total by block |
Llanos 34 | 61% | 13% | 0% | 1% | 0% | 24% | 0% | 100% |
Platanillo | 83% | 0% | 0% | 7% | 0% | 11% | 0% | 100% |
Fell | 18% | 18% | 16% | 10% | 29% | 10% | 0% | 100% |
Aguada Baguales | 83% | 5% | 0% | 0% | 0% | 10% | 2% | 100% |
El Porvenir | 91% | 0% | 0% | 0% | 0% | 6% | 3% | 100% |
Puesto Touquet | 0% | 0% | 87% | 0% | 0% | 13% | 0% | 100% |
Administrative | 41% | 0% | 0% | 0% | 0% | 0% | 59% | 100% |
Fugitive emissions arise from unintentional failures in equipment or systems: methane leaks in gas transport, low efficiency flare stacks, leaks in seals or gaskets, and integrity failures in treatment and pumping systems.
In 2020 fugitive emissions totaled 82,262.3 tCO2e; 21% of total emissions.
Total emissions by source and gas type
GeoPark emissions by source
(Scope 1-2 kilo tonnes CO₂e-2020)
*Methane intensity estimated at 1.7%
**Others: Motors, ventilated emissions, contracted energy
GeoPark emissions by gas type
(Scope 1-2 kilo tonnes)

Fugitive emissions by block and type of gas
The following table shows the data on GHG emissions by type of contaminant (CO2, CH4 and N2O), associated with fugitive emissions.
Llanos 34 | 343 | 2,612 | - | 73,469 |
Platanillo | 14 | 111 | - | 3,123 |
Fell | 5 | 113 | - | 3,167 |
Aguada Baguales | 6 | 52 | - | 1,461 |
El Porvenir | 2 | 18 | - | 494 |
Puesto Touquet | 1 | 20 | - | 548 |
Administrative | ||||
Total | 371 | 2,925 | - | 82,263 |
As part of our GHG emissions reduction strategy we will manage methane emissions through the implementation of initiatives based on the following actions:
In defining the 2020 GHG emissions baseline, we consolidated total energy use, including energy consumption per application (generators and pumps) and the energy efficiency of applications that require energy (generators, boilers, pumps, transportation).
(302-1) IPIECA: CCE-6 and CCE-7 Energy consumption
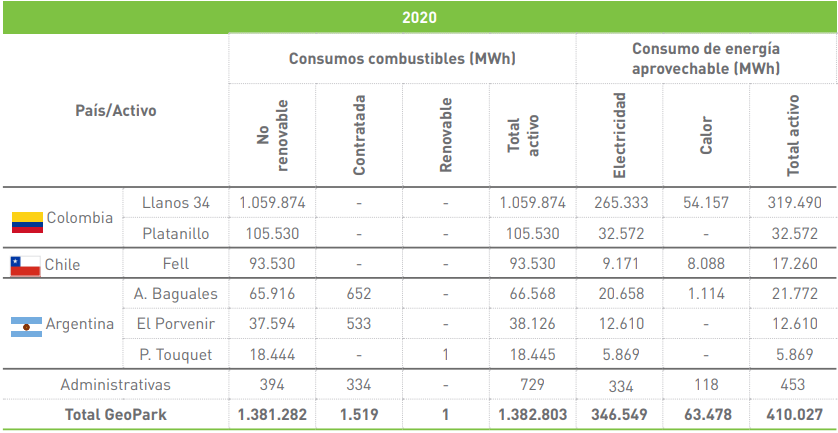
(302-3) Energy intensity 2020

Fuel consumption

We took several measures to increase energy efficiency in our assets in 2020, including the following:
Power generation and emissions reduction


Centralization of energy supply

Management of renewable sources